

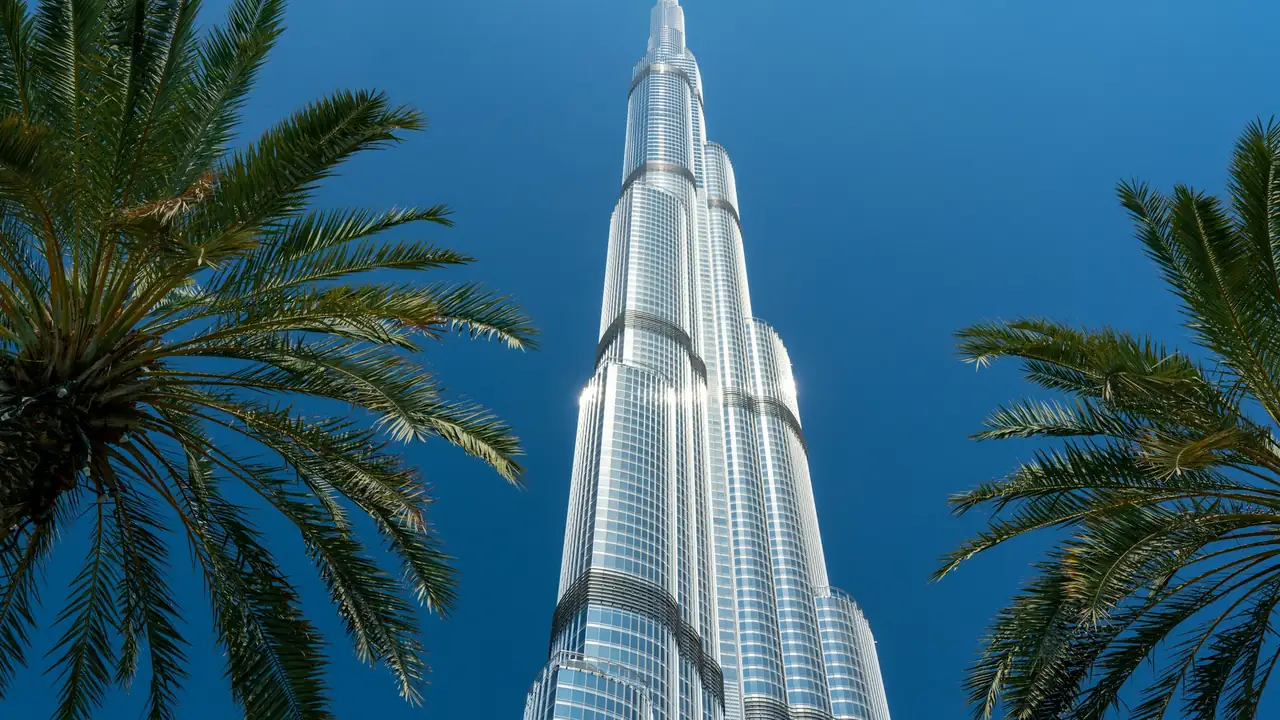
Most pages that answer "how much is an apartment in Burj Khalifa" quote asking prices from listings. This one uses closed sales: the median price of ready one-bedroom apartments in the tower, year by year, from the Dubai Land Department (DLD) sales registry. It then asks a simpler question than "is it worth it": what happened to a buyer who entered in each of those years and held until today? The numbers are the same ones used in our game, Dubai Pack.
These are historical transaction figures, not investment advice and not a forecast. Past price paths say nothing about future ones. A median is the middle of a set of sales, not the price of any particular unit: floor, view and condition move a Burj Khalifa price by a wide margin.
The short answer
- Median one-bedroom sale, last 12 months (24.09.2025–23.09.2026): AED 3,050,000, across 43 registered sales. At the dirham's dollar peg (USD 1 = AED 3.6725) that is about USD 830,500.
- Peak year: 2014, median AED 3,945,888.
- Lowest year: 2020, median AED 1,750,000.
- Gross rental yield today: 3.8%, the lowest of the 33 property types in our dataset.
- Worst entry: 2014, a loss of 26% after the 4% DLD transfer fee if held to today.
Burj Khalifa apartment price history, one bedroom
Source: DLD sales registry (Dubai Pulse export) plus our own pull of the live DLD open-data API for 2026. Ready units only, residential, clean records.
| Year | Median sale, AED | Median, USD (at peg) | Sales | Typical size, m² |
|---|---|---|---|---|
| 2012 | 2,632,944 | ≈ 717,000 | 12 | 102 |
| 2013 | 3,256,396 | ≈ 887,000 | 16 | 102.5 |
| 2014 | 3,945,888 | ≈ 1,074,000 | 11 | 105.3 |
| 2016 | 2,806,543 | ≈ 764,000 | 14 | 102.5 |
| 2017 | 2,800,000 | ≈ 762,000 | 12 | 102.1 |
| 2018 | 2,000,000 | ≈ 545,000 | 11 | 102 |
| 2019 | 1,800,000 | ≈ 490,000 | 18 | 97.5 |
| 2020 | 1,750,000 | ≈ 477,000 | 29 | 101.8 |
| 2021 | 2,100,000 | ≈ 572,000 | 30 | 101.8 |
| 2022 | 2,800,000 | ≈ 762,000 | 27 | 101.8 |
| 2023 | 3,000,000 | ≈ 817,000 | 56 | 102.5 |
| 2024 | 3,120,000 | ≈ 850,000 | 39 | 102 |
| 2025 | 3,050,000 | ≈ 830,000 | 44 | 101.8 |
| Last 12 months | 3,050,000 | ≈ 830,500 | 43 | — |
USD figures are the AED median divided by 3.6725 and rounded.
Read the shape rather than any single row. The median climbed to its 2014 peak, fell by about AED 2.2 million (−56%) to the 2020 low, and then recovered in three years. Since 2023 it has sat at AED 3.0–3.1 million, still about 23% below the 2014 peak. For how the wider market moved in the same years, see Dubai property prices by year.
What about 2010, when the tower opened?
A common search is "Burj Khalifa apartment price in 2010". We do not publish a figure for it. Our series for the tower starts in 2012, the first year that meets the minimum-sales rule described below; there is no 2010 or 2011 card for the tower, and we do not stretch a market index to cover a single building.
What we can show is the district. For a one-bedroom in Downtown Dubai, where the tower stands, the game's 2010 value is an estimate of ≈ AED 1,096,000, derived from the REIDIN house-price index published by the BIS, not from DLD sales. That is the neighbourhood, not the tower, and it carries the uncertainty of any index-based estimate for the 2008–2011 crash years. The IMF's 2011 country report put the fall from the 2008 peak at roughly 50%.
Why this is a small sample
For every other area in the game, a year needs at least 25 sales to count. Burj Khalifa one-bedrooms rarely reach that, so the threshold is lowered to 10 sales per year and the series is flagged as a small sample. In practice:
- one or two high-floor sales can move a year's median noticeably;
- 2015 had fewer than ten one-bedroom sales, so it is missing from the table;
- rent in the game uses Ejari tenancy contracts for one-bedrooms in Downtown Dubai (AED 115,000 a year, 4,104 contracts) — there is no separate rental sample for the tower itself.
Treat the series as the corridor the price lived in, not a price list.
Buy, rent or sell: the outcome for each entry year
The game offers three moves for each year. Buy: bought that year, held to today; outcome = today's median − that year's median − DLD fee. Rent: the same, plus gross rent accumulated over the holding period. Sell: how much better it was to sell that year than to keep holding. The DLD fee is 2% for purchases up to and including 2013 and 4% from 2014. Trustee fees, title deed and agent commission are not included.
| Entry year (play it) | Buy, AED | Buy | Rent | Sell |
|---|---|---|---|---|
| 2012 | +364,397 | +14% | +63% | −16% |
| 2013 | −271,524 | −8% | +29% | +6% |
| 2014 | −1,053,724 | −26% | +2% | +23% |
| 2016 | +131,195 | +4% | +36% | −9% |
| 2017 | +138,000 | +5% | +33% | −9% |
| 2018 | +970,000 | +47% | +81% | −52% |
| 2019 | +1,178,000 | +63% | +97% | −69% |
| 2020 | +1,230,000 | +68% | +98% | −74% |
| 2021 | +866,000 | +40% | +62% | −45% |
| 2022 | +138,000 | +5% | +19% | −9% |
| 2023 | −70,000 | −2% | +8% | −2% |
| 2024 | −194,800 | −6% | +1% | +2% |
| 2025 | −122,000 | −4% | 0% | 0% |
The 2014 buyer: minus 26 percent
Of all 2014 entries in the game — 32 area-and-size combinations — the Burj Khalifa one-bedroom did worst. A buyer at the 2014 median of AED 3,945,888 paid another 4% (about AED 157,800) to DLD. Today's median is AED 3,050,000. Held to today: −AED 1,053,724, or −26%, roughly −USD 287,000. Adding every year of gross rent (about AED 1.13 million in the game's calculation) lifts the result only to +2%. Twelve years of rent went into covering the price fall.
The context, from the market events recorded in the game: Dubai won the Expo 2020 bid in November 2013 and prices ran to a peak in autumn 2014; the DLD transfer fee went from 2% to 4% in October 2013 (Executive Council Resolution No. 30 of 2013); the UAE Central Bank's loan-to-value limits followed. The IMF's 2015 report describes prices falling from mid-2014 on heavy new supply, cheaper oil and a strong dollar, and the REIDIN index kept sliding until November 2020.
The tower fell harder than its own district. A Downtown one-bedroom bought at the 2014 median of AED 1,800,000 is up 10% today after the fee; the Burj unit is down 26%.
The 2018–2020 buyer: the mirror image
Entries in 2018–2020, when the median sat between AED 1.75 and 2.0 million, are up 47–68% on price alone and 81–98% with rent. Same building, same floor plan, and a 94-point gap between buying in 2014 and buying in 2020. On this data the entry year decided the outcome far more than the address did. The full picture across areas is in was it a good time to buy in Dubai.
Why 2023–2025 show small losses
The 2023, 2024 and 2025 cards are slightly negative, but this is not a price crash. The 2025 median and today's median are identical at AED 3,050,000; the −4% on the 2025 card is the DLD fee on a holding of under a year. For 2024, the fee is joined by a 2% gap between medians (AED 3,120,000 then, AED 3,050,000 now) — within the noise of a 39–44-sale sample.
Rental yield: 3.8%, the lowest in the dataset
Median annual rent for a one-bedroom is AED 115,000 (Ejari contracts, last 12 months, Downtown sample as noted above). Against AED 3,050,000 that is a gross yield of 3.8%. For comparison, a Downtown one-bedroom yields 5.6% and an International City studio 9.0%. The full table is in rental yield by area in Dubai.
That is a gross figure. Service charges, management, vacancy and the municipal housing fee still come off it, and in a landmark tower the annual service charge is a line worth checking for the specific building before you commit. How service charges are set and approved is covered in service charges in Dubai. Net yield will be lower than 3.8%.
Ownership and the Golden Visa
What rights a foreign buyer actually receives depends on the zone's status and the title documents. The difference between freehold and leasehold, and what to check, is explained in freehold vs leasehold.
DLD grants the investor Golden Visa for property worth AED 2 million or more at the time of purchase: ten years, renewable. Today's one-bedroom median in the tower is above that threshold, but eligibility is judged on the price of your own transaction, not on a median. Conditions, mortgaged property and family sponsorship are covered in Golden Visa through property.
FAQ
How much is an apartment in Burj Khalifa?
The median registered sale for a one-bedroom over the 12 months to 23.09.2026 was AED 3,050,000, about USD 830,500. Individual units sell well above and below that.
What did a Burj Khalifa apartment cost in 2014 and in 2020?
AED 3,945,888 and AED 1,750,000 respectively, by DLD median for one-bedrooms. Those are the peak and the low of the series.
Is a Burj Khalifa apartment a good rental investment?
We don't rate investments. What the data shows is a 3.8% gross yield today, the lowest of 33 property types in the dataset, before service charges and other costs.
What costs come on top of the price?
The 4% DLD transfer fee — AED 122,000 on the current median — plus trustee, title deed and agent fees. Use the purchase costs calculator for the full figure.
Sources
- DLD sales registry (Dubai Pulse export, 2004 – 14.09.2026) and DLD open data, API pull of 24.09.2026.
- Rent: Ejari contracts, last 12 months, via Dubai Data.
- 2010 district estimate: BIS / REIDIN index; IMF Country Report 11/111.
- Market events: Executive Council Resolution No. 30 of 2013, IMF Country Report 15/219.
- DLD Golden Visa for investors.
Before a real purchase
A median describes a market; a purchase is one apartment with its own floor, view, service-charge arrears, encumbrances and title history. Our real estate practice checks the unit and its documents before any deposit and handles the DLD registration. It helps to run the full cost of entry through the purchase costs calculator first.