

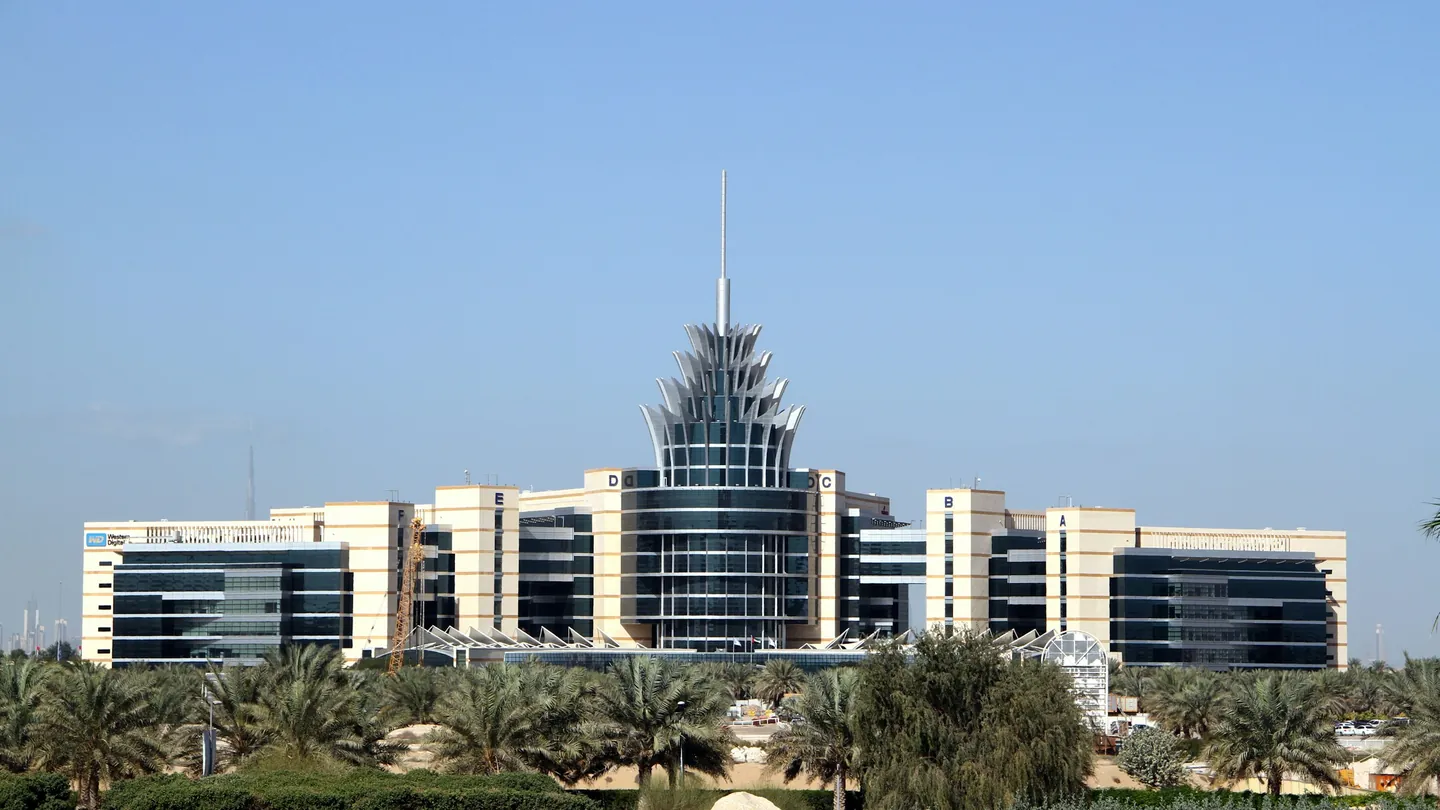
People searching for Dubai Silicon Oasis usually want one of three things: what an apartment costs, how prices have moved, and whether buying here has worked out. The third question is the one we can answer only with the past, and the past here is unusual. Between 2014 and 2020 the median one-bedroom price in Silicon Oasis fell 39%. Yet across all 41 entry points we track — studios, one-bedrooms and two-bedrooms bought in any year from 2012 to 2025 — not a single purchase at the median shows a loss today.
This page is built from the Dubai Land Department (DLD) sales register (ready apartments only) and from median rents on Ejari-registered tenancy contracts. "Today" means the twelve months from 24.09.2025 to 23.09.2026. Dollar figures use the dirham peg, 1 USD = 3.6725 AED.
These are historical deal figures, not investment advice and not a forecast. A clean record for past buyers does not mean the next buyer is protected. An area median is the middle of a year's registered sales, not the value of any particular apartment: building, floor, size and condition move a real price either way.
Silicon Oasis apartment prices today
| Unit | Median sale, AED | In USD | DLD sales, 12 months | Median rent, AED/year | Ejari contracts | Gross yield |
|---|---|---|---|---|---|---|
| Studio | 462,250 | ~$125,900 | 116 | 40,425 | 3,426 | 8.7% |
| 1 bedroom | 752,500 | ~$204,900 | 354 | 54,000 | 8,319 | 7.2% |
| 2 bedrooms | 1,250,000 | ~$340,400 | 93 | 75,000 | 3,071 | 6.0% |
Sources: DLD register (September–December 2025) plus our own pull of the live DLD open-data API (2026) for prices; Dubai Data (Ejari) for rents. Two things stand out. The district is thinly traded — 563 ready-unit sales across the three types in a year, against 4,250 in JVC. And it is let far more than it is sold: 8,319 one-bedroom leases against 354 one-bedroom sales. With only 93 two-bedroom sales behind the median, that figure can swing more from year to year than the market itself does.
Silicon Oasis price per sq ft
DLD records unit size in square metres. Our yardstick is simple: the year's median price ÷ the year's median size ÷ 10.764. For a 2025 one-bedroom: 675,000 / 76.1 m² ≈ 8,870 AED/m² ≈ 824 AED/ft². It is a median divided by a median, not a valuation.
| Unit | 2012 | Peak year | Low year | 2025 |
|---|---|---|---|---|
| Studio | ~684 AED/ft² | ~972 (2016) | ~649 (2022) | ~980 AED/ft² |
| 1 bedroom | ~638 AED/ft² | ~822 (2014) | ~488 (2020) | ~824 AED/ft² |
| 2 bedrooms | ~639 AED/ft² | ~891 (2017) | ~488 (2020) | ~917 AED/ft² |
The one-bedroom series is the cleanest one here: median size stayed between 72.7 and 78.7 m² every year, so its price moves are mostly price, not a change in what was sold. Two-bedrooms are noisier — the median unit sold in 2012 was 103.4 m², in 2020 it was 127.9 m².
Price history, 2012–2025
Median sale price, AED, ready apartments, DLD register. A year enters the series only with at least 25 sales, which is why the two-bedroom row has no 2019.
| Year | Studio | 1 bed | 1 bed sales | 2 bed |
|---|---|---|---|---|
| 2012 | 302,821 | 509,250 | 466 | 710,746 |
| 2013 | 329,000 | 510,000 | 991 | 830,000 |
| 2014 | 387,000 | 660,000 | 955 | 1,011,029 |
| 2015 | 420,000 | 621,841 | 868 | 1,020,000 |
| 2016 | 430,000 | 635,000 | 549 | 1,000,300 |
| 2017 | 415,659 | 610,000 | 540 | 1,070,000 |
| 2018 | 350,000 | 565,000 | 373 | 850,000 |
| 2019 | 299,000 | 475,000 | 213 | — |
| 2020 | 340,000 | 400,000 | 179 | 671,980 |
| 2021 | 310,000 | 400,250 | 256 | 765,000 |
| 2022 | 295,000 | 410,000 | 395 | 782,500 |
| 2023 | 330,000 | 460,000 | 595 | 772,500 |
| 2024 | 398,732 | 555,000 | 651 | 1,000,000 |
| 2025 | 440,000 | 675,000 | 854 | 1,180,000 |
| Today | 462,250 | 752,500 | 354 | 1,250,000 |
Each unit type peaked and bottomed in a different year. The one-bedroom topped out in 2014 and hit its low in 2020–2021; the two-bedroom peaked in 2017 (1,070,000) and fell 37% to 2020 (671,980); the studio peaked in 2016 (430,000) and bottomed only in 2022 (295,000), −31%. The 2019 studio median of 299,000 comes with a median size of just 33.3 m², against 41–42 m² in neighbouring years — part of that low is smaller flats changing hands. For the Dubai-wide series, see Dubai property prices by year.
A 39% slide with no losing entry: how both are true
We compare districts on one reference unit, the one-bedroom. Silicon Oasis: 509,250 AED in 2012, a peak of 660,000 in 2014, a low of 400,000 in 2020 (−39%), 752,500 today — 14% above the old peak. That last number decides everything. Other districts fell by similar amounts but have not climbed back past their peak:
| District (1 bed) | Peak → low | Today vs peak | Losing "buy" cards |
|---|---|---|---|
| Dubai Silicon Oasis | −39% | +14% | 0 of 41 |
| Discovery Gardens | −43% | +7% | 2 of 36 |
| International City | −40% | −10% | 8 of 36 |
| Dubai Sports City | −51% | −16% | 16 of 42 |
| JVC | −19% | +44% | 2 of 42 |
Peak, low and card counts come from our district summaries of the DLD register; "today vs peak" is our arithmetic on the same medians (for example 752,500 / 660,000 = +14%). Depth of the fall did not separate winners from losers; how far prices later rose above the old peak did. Every district side by side: Dubai areas compared.
What each entry year returned
"Buy" = today's median − the year's median − the DLD transfer fee (2% up to 2013, 4% from 2014, per Executive Council Resolution No. 30 of 2013). Trustee, title deed and agent costs are left out. "Let" adds estimated gross rent from purchase to today. Every percentage opens that card in our game.
| Bought in | Studio: buy | Studio: let | 1 bed: buy | 1 bed: buy, USD | 2 bed: buy |
|---|---|---|---|---|---|
| 2012 | +50% | +200% | +45% | +$63,462 | +72% |
| 2013 | +38% | +168% | +45% | +$63,254 | +48% |
| 2014 | +15% | +117% | +10% | +$17,999 | +19% |
| 2015 | +6% | +92% | +16% | +$28,805 | +18% |
| 2016 | +3% | +78% | +14% | +$25,078 | +20% |
| 2017 | +7% | +75% | +19% | +$32,158 | +12% |
| 2018 | +27% | +97% | +28% | +$44,901 | +41% |
| 2019 | +49% | +119% | +52% | +$70,388 | — |
| 2020 | +31% | +83% | +81% | +$91,627 | +79% |
| 2021 | +43% | +92% | +81% | +$91,556 | +57% |
| 2022 | +51% | +93% | +76% | +$88,795 | +54% |
| 2023 | +35% | +65% | +57% | +$74,636 | +56% |
| 2024 | +11% | +29% | +30% | +$47,733 | +20% |
| 2025 | +1% | +9% | +7% | +$13,751 | +2% |
The 2025 row is worth a second look. In many districts of our game, 2025 purchases are negative because a 4% fee paid on entry cannot be recovered in under a year. In Silicon Oasis the medians rose enough over that period — one-bedrooms from 675,000 to 752,500 AED — to keep all three cards above zero, if only just for the studio (+4,650 AED).
Worst and best entry years, and why
Averaged across the three unit types, the weakest entry year was 2025 (+3%) and the strongest was 2020 (+63%) (district summary of our game).
2025 is weak for a mechanical reason: the 4% fee. The market itself was busy — more than 270,000 transactions worth AED 917 billion that year (Dubai Finance Department, 12.01.2026) — but a record count of deals is not the same as one district's median rising faster than the fee within twelve months. Among years where the fee has long been absorbed, 2016 was the weakest, averaging about +12% ((3 + 14 + 20) / 3). That was the middle of a long slide: the IMF (Country Report 15/219) described prices falling from mid-2014 on heavy supply, cheap oil and a strong dollar, and the REIDIN index (via BIS) fell 33% from October 2014 to November 2020.
2020 was the bottom. In April 2020 Dubai ran round-the-clock sterilisation and Expo was postponed to 2021 (Dubai Media Office, 04.04.2020); the city index bottomed in November 2020. In 2021, DLD registered 84,196 deals, 66% more than in 2020. A one-bedroom bought at the 2020 median of 400,000 AED (about $108,900) is at 752,500 today: +336,500 AED after the 16,000 fee, or +81% — about +$91,600. It is the best card of its year across the five districts added to our game in this round, and a Silicon Oasis one-bedroom also tops every entry year from 2021 to 2025.
For the city-wide view of good and bad entry years, see was it worth buying property in Dubai.
Rental yield: studio 8.7%, two-bedroom 6.0%
On Ejari contracts from the last twelve months, gross yield falls as units get bigger: studio 8.7% (40,425 / 462,250), one-bedroom 7.2%, two-bedroom 6.0%. The studio also grew least in price since 2012, so the trade-off is visible inside one district.
The weakest card shows it best. A studio bought in 2016 at the studio peak, 430,000 AED, is worth 462,250 today: +3% on price. Let continuously, it would have earned an estimated 336,000 AED in gross rent, and the "let" result is +78%. None of the 41 "let" cards in Silicon Oasis is negative. And the "sell" move — exiting early instead of holding — comes out worse than holding on every one of the 41 cards.
Limits of these rent figures: they are gross (before service charges, voids, maintenance and management); past rents are rebuilt from the district's Ejari rent index, and years with fewer than 300 contracts are held at the first reliable year's level — an assumption. How to get from gross to net is in rental yield in Dubai; Silicon Oasis against other districts is in rental yield by area. Landlord-tenant rules and disputes are covered in rental disputes at the RDC.
Off-plan now dominates the district's register
Everything above is ready stock. The register shows the district has shifted. Off-plan share of all residential registrations in Silicon Oasis (DLD): 4% in 2013, 5% in 2014, 52% in 2016, 12% in 2021, 37% in 2024 — and 64% in 2025, alongside 1,423 ready-unit sales. Roughly two registrations in three last year were for property not yet built. Those contract prices are not in our medians and should not be compared with them directly.
Off-plan buying in Dubai runs on specific rules. Buyer payments go to a project escrow account and reach the developer in construction stages (Dubai Law No. 8 of 2007) — how to verify the account and the Oqood registration is in escrow and Oqood. The 4% DLD fee is paid at Oqood pre-registration and not charged again on handover. If a buyer stops paying, what the developer may keep under Article 11 of Law No. 13 of 2008 (as amended by Law No. 19 of 2017) depends on how complete the project is — up to 25% or up to 40% of the property value; the off-plan termination calculator runs the numbers. For the trade-offs, see off-plan vs ready property and checking a developer.
Golden Visa. The 10-year investor visa requires property worth at least AED 2 million at purchase (DLD). Every Silicon Oasis median is below it: the two-bedroom by 750,000 AED, the one-bedroom by 1,247,500, the studio by 1,537,750. Whether an off-plan unit counts is something we confirm on the date of the deal. Details: Golden Visa through property.
Questions about Silicon Oasis prices
Is Dubai Silicon Oasis a good investment?
We can only describe the past. Of 41 entry points from 2012 to 2025, none shows a loss at today's median, and none is negative once gross rent is added; results range from +1% to +81% on price. That is history, not advice, and not a forecast.
How much is a one-bedroom apartment in Silicon Oasis?
The median registered sale over the 12 months to 23.09.2026 was 752,500 AED, about $204,900, across 354 DLD sales. A specific unit can be well above or below.
What is the price per square foot in Dubai Silicon Oasis?
As a rough 2025 yardstick (median price ÷ median size): about 980 AED/ft² for studios, 824 for one-bedrooms and 917 for two-bedrooms. At the 2020 low, one-bedrooms were about 488 AED/ft².
When were Silicon Oasis prices at their lowest?
One-bedrooms in 2020–2021 (400,000 and 400,250 AED), two-bedrooms in 2020 (671,980), studios in 2022 (295,000).
What rent does a Silicon Oasis studio earn?
Median Ejari rent is 40,425 AED a year, a gross yield of 8.7% on the 462,250 median price, before any costs.
Before you buy
A median gives you the price range, not the answer to whether a particular apartment is clean: service-charge arrears, what the title deed says, and — for off-plan — whether the contract is registered in Oqood and payments go to the project escrow. Our real estate practice checks the property, documents and contract before you pay; we do not promise an outcome. Official fees on any price can be estimated with the purchase costs calculator, and the full list is in costs of buying property in Dubai.
Sources: DLD open data and the DLD sales register; Ejari rents via Dubai Data and the Ejari rent index; REIDIN index via the BIS; IMF Country Report 15/219; Resolution No. 30 of 2013; Dubai Media Office, 04.04.2020; DLD, 2021 totals; Dubai Finance Department, 12.01.2026; DLD Golden Visa; dirham peg.