

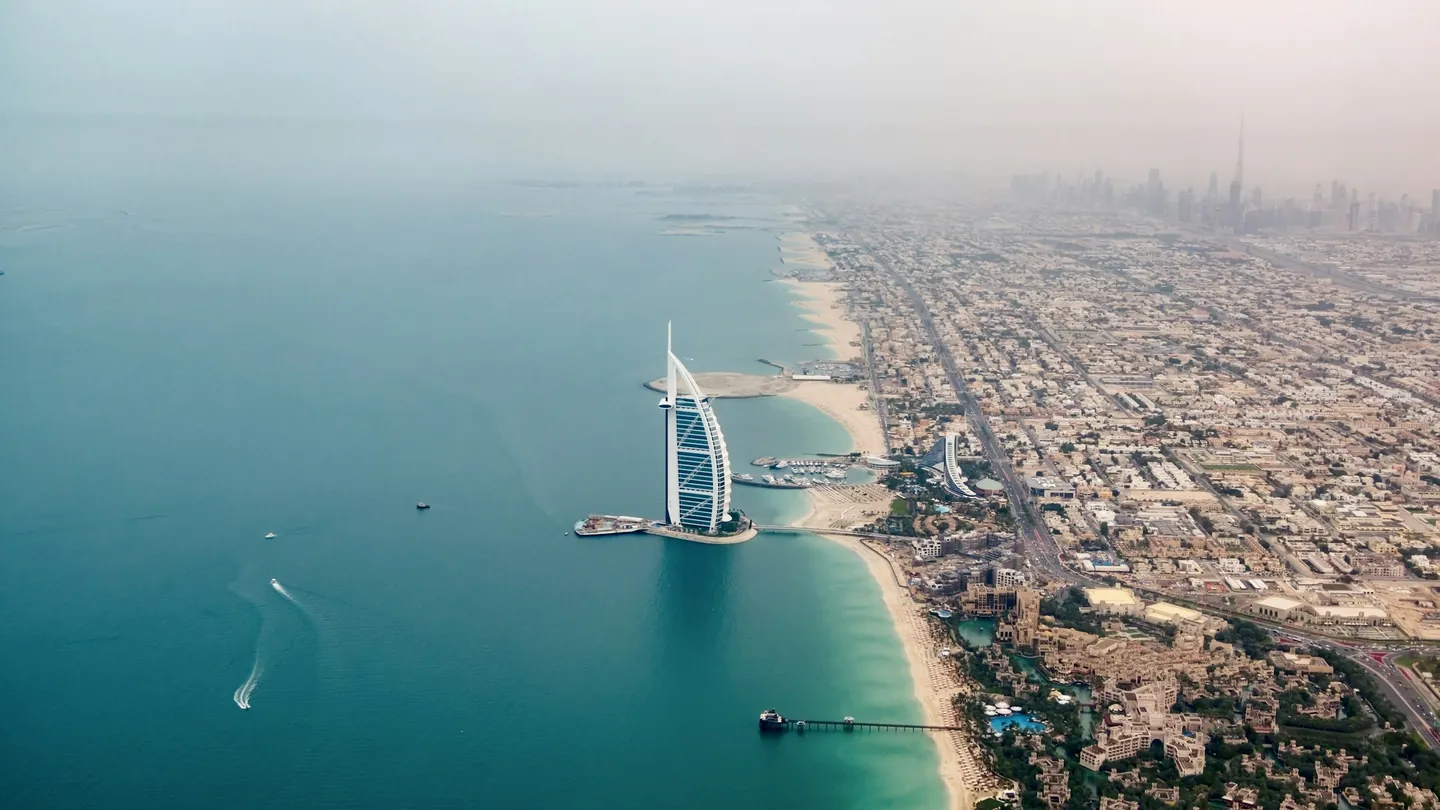
Most "Dubai areas compared" pages rank communities by asking prices and projected yields. This one compares them on what was actually paid. For each of the 12 communities in our game "Dubai Pack" we take one benchmark unit — a one-bedroom apartment, or a three-bedroom villa in Arabian Ranches — and track its median registered sale price in the Dubai Land Department (DLD) register: in 2012, at the 2014–2015 peak, at the 2019–2021 trough and today. "Today" means the 12 months from 24.09.2025 to 23.09.2026 (villas: 15.09.2025 to 14.09.2026).
US dollar figures use the dirham peg, 1 USD = 3.6725 AED.
These are historical transaction figures, not investment advice and not a forecast. How an area behaved in past cycles says nothing about how it will behave next. An area median is the middle of a year's sales, not the value of any particular apartment.
Method in five lines
- Prices: median sale price of ready residential units (off-plan excluded) from the DLD sales register (Dubai Pulse export to 14.09.2026) plus our own pull of DLD open data for 2026. A year counts only with at least 25 sales.
- Peak is the highest median of 2014–2015; trough the lowest of 2019–2021. Percentages are changes in the median price only — no transfer fee, no rent.
- Burj Khalifa is a building inside Downtown Dubai, not a community. It gets its own row because its history differs, but it is a small sample (threshold of 10 sales a year; 2015 is missing).
- Sales in 12 months add up all unit types we track in that area, not every deal in the community.
- Yield is gross: median annual rent from Ejari contracts divided by the median price. The bedroom-by-bedroom breakdown is in rental yield by area.
Property prices by area: the benchmark unit today
Sorted from the most to the least expensive benchmark unit.
| area | benchmark | today, AED | today, USD | 2012, AED | 2012 → today | sales, 12 months | gross yield range |
|---|---|---|---|---|---|---|---|
| Arabian Ranches | 3BR villa | 5,100,000 | 1,388,700 | 2,100,000 | +143 % | 61 | 4.6 % |
| Burj Khalifa (building in Downtown, small sample) | 1BR | 3,050,000 | 830,497 | 2,632,944 | +16 % | 43 | 3.8 % |
| Palm Jumeirah | 1BR | 2,900,000 | 789,653 | 1,802,430 | +61 % | 573 | 4.6–5.7 % |
| Downtown Dubai | 1BR | 2,050,000 | 558,203 | 1,200,000 | +71 % | 1,357 | 5.3–5.6 % |
| JBR | 1BR | 1,745,000 | 475,153 | 1,067,585 | +63 % | 369 | 5.7–6.2 % |
| Dubai Marina | 1BR | 1,525,000 | 415,248 | 900,000 | +69 % | 1,881 | 5.4–6.4 % |
| Business Bay | 1BR | 1,450,000 | 394,826 | 972,918 | +49 % | 2,204 | 5.8–6.8 % |
| The Greens | 1BR | 1,450,000 | 394,826 | 760,888 | +91 % | 378 | 6.1–6.2 % |
| JLT | 1BR | 1,130,000 | 307,692 | 656,040 | +72 % | 814 | 6.3–8.0 % |
| JVC | 1BR | 1,000,000 | 272,294 | 758,000 | +32 % | 4,250 | 6.4–7.9 % |
| Dubai Sports City | 1BR | 700,000 | 190,606 | 598,128 | +17 % | 1,158 | 7.5–8.5 % |
| International City | 1BR | 450,000 | 122,532 | 320,000 | +41 % | 1,068 | 8.9–9.0 % |
Sources: DLD register and DLD open data (prices, sales counts); Ejari contracts via Dubai Data (rents). The yield column is the range across every unit type we track in that area, not just the benchmark.
Three things stand out before any history:
- The spread is wide. A one-bedroom on Palm Jumeirah sells for 6.4 times the International City median (2,900,000 / 450,000). In 2012 the ratio was 5.6 (1,802,430 / 320,000).
- Volume is not where the prices are. JVC logged 4,250 sales across three unit types in 12 months; Burj Khalifa one-bedrooms, 43. Volume tells you how often units change hands, not where prices go.
- Yield runs the other way from price. The cheapest areas show 8–9 % gross, Palm Jumeirah and Downtown around 5 %, Burj Khalifa 3.8 %. The next section shows what that meant for buyers at the last peak.
Which areas fell most in 2014–2020
By the REIDIN index published by the Bank for International Settlements, Dubai prices slid for six years, from October 2014 to November 2020, losing 33 %. The IMF (Country Report 15/219, August 2015) tied the start of the decline to heavy new supply, cheaper oil and a strong US dollar. Covid closed the cycle in 2020.
The citywide number hides a threefold difference between areas. Ranked by the peak-to-trough fall of the benchmark median:
| rank | area | peak 2014/15, AED (year) | trough 2019–21, AED (year) | peak → trough | trough → today |
|---|---|---|---|---|---|
| 1 | Burj Khalifa (small sample) | 3,945,888 (2014) | 1,750,000 (2020) | −56 % | +74 % |
| 2 | Dubai Sports City | 831,932 (2015) | 405,292 (2020) | −51 % | +73 % |
| 3 | JLT | 1,069,153 (2014) | 610,000 (2020) | −43 % | +85 % |
| 4 | JBR | 1,650,000 (2014) | 950,000 (2020) | −42 % | +84 % |
| 5 | The Greens | 1,200,000 (2014) | 705,062 (2020) | −41 % | +106 % |
| 6 | International City | 500,000 (2014) | 300,000 (2021) | −40 % | +50 % |
| 7 | Palm Jumeirah | 2,300,000 (2014) | 1,404,207 (2019) | −39 % | +107 % |
| 7 | Arabian Ranches (villa) | 2,980,444 (2014) | 1,815,000 (2020) | −39 % | +181 % |
| 9 | Business Bay | 1,380,000 (2015) | 850,000 (2020) | −38 % | +71 % |
| 10 | Downtown Dubai | 1,800,000 (2014) | 1,150,000 (2019) | −36 % | +78 % |
| 11 | Dubai Marina | 1,300,000 (2014) | 855,000 (2020) | −34 % | +78 % |
| 12 | JVC | 695,000 (2015) | 565,000 (2020) | −19 % | +77 % |
Two rows need a warning label. JVC had no real 2014 peak: its 2012 one-bedroom median (AED 758,000) is higher than 2014 or 2015 (650,000 and 695,000), because the typical unit sold shrank from 88.9 m² in 2012 to 69.5 m² in 2014 and 72 m² in 2025. So the −19 % is distorted by the mix of deals more than anywhere else. Burj Khalifa sees 11 to 56 one-bedroom sales a year; one unusual deal moves the median.
Which areas are still below their 2014 peak
Comparing today's median with the peak (our arithmetic from the two columns above):
- Burj Khalifa: 3,050,000 / 3,945,888 − 1 = −22.7 %.
- Dubai Sports City: 700,000 / 831,932 − 1 = −15.9 %.
- International City: 450,000 / 500,000 − 1 = −10.0 %.
Every other benchmark is now above its peak, from about +5 % (Business Bay, 1,450,000 vs 1,380,000) and +6 % (JLT, JBR) to +26 % (Palm Jumeirah) and +71 % (the Arabian Ranches villa, 5,100,000 vs 2,980,444). The strongest rebounds from the trough were the villa (+181 %), Palm Jumeirah (+107 %) and The Greens (+106 %); the weakest, International City (+50 %).
For the year-by-year path of each area see Dubai property prices by year. The previous cycle — REIDIN down 37 % from July 2008 to December 2010 — is covered in the 2008–2011 crash.
Where the losing cards cluster
Our game has 539 market cards, one per unit type and purchase year. The "buy" result is today's median minus the purchase-year price minus the DLD transfer fee. 64 cards end in the red, and they are anything but evenly spread:
| area | cards | in the red | excluding 2024–25 buys | example |
|---|---|---|---|---|
| Dubai Sports City | 42 | 16 | 14 (2014–2018) | studio, 2015: −29 % |
| International City | 36 | 8 | 8 (all 2014–2017) | 1BR, 2016: −12 % |
| Dubai Marina | 87 | 10 | 6 (all 4BR) | 4BR, 2014: −12 % |
| JBR | 54 | 7 | 2 (2014) | 3BR, 2014: −10 % |
| Business Bay | 42 | 6 | 2 (2BR, 2014–15) | 2BR, 2015: −1 % |
| Burj Khalifa | 13 | 5 | 3 (2013, 2014, 2023) | 1BR, 2013: −8 % |
| JLT | 54 | 4 | 0 | 1BR, 2024: −1 % |
| Downtown Dubai | 54 | 3 | 0 | 1BR, 2025: −4 % |
| JVC | 42 | 2 | 0 | studio, 2025: −2 % |
| Palm Jumeirah | 65 | 1 | 0 | 1BR, 2025: −6 % |
| The Greens | 36 | 1 | 0 | 1BR, 2025: −AED 6,000 |
| Arabian Ranches | 14 | 1 | 0 | villa, 2025: −1 % |
Sports City alone holds a quarter of all losing cards (16 of 64) and 38 % of its own. International City's eight are all purchases made in 2014–2017, near the top of the last cycle. Palm Jumeirah and The Greens have exactly one each — both bought in 2025.
Most 2024–2025 losses are not price falls. Today's median is about 1 % above the 2025 median, and a 4 % DLD fee on a unit held under a year eats that and more. The Greens one-bedroom: AED 1,400,000 in 2025, 1,450,000 today, minus AED 56,000 fee — a result of −AED 6,000.
Rent changes the picture for the older losers. With accumulated gross rent, all 14 pre-2024 Sports City losers and all 8 International City losers come out positive in the game, between +25 % and +71 %. Treat that with care: past rents are rebuilt from each area's Ejari index, and the earliest years are an assumption.
The single deepest loss in the game in percentage terms: a Sports City studio bought at the 2015 median of AED 640,000, worth 470,000 today. Price-only result −AED 195,600 (−29 %, about −USD 53,300); with rent, +25 %.
At the other end, a Palm Jumeirah two-bedroom at the 2019 median: AED 1,650,000 then, 4,500,000 today. Minus the 4 % fee (AED 66,000), that is +AED 2,784,000 (+162 %, about USD 758,000). The difference between these two cards is less the area than the entry year — the same Palm posted a loss for a 2025 purchase.
The villa is the largest gain in AED among the benchmarks: bought at the 2020 median of 1,815,000, it is +AED 3,212,400 (+170 %) today, on a window of 61 villa sales. Test any combination yourself in the game's buy mode, or read which entry years worked best and worst across all areas.
Dubai areas against the AED 2 million Golden Visa line
A 10-year Golden Visa is available for property worth at least AED 2 million at the time of purchase (DLD); the threshold was cut from AED 5 million in 2022 (Gulf News, 20.04.2022). A mortgaged property qualifies with the bank's no-objection letter, and you must be in the UAE to apply.
Where today's medians sit relative to that line:
| position | areas (median, AED) |
|---|---|
| benchmark unit above AED 2M | Arabian Ranches villa (5,100,000), Burj Khalifa 1BR (3,050,000), Palm Jumeirah 1BR (2,900,000), Downtown 1BR (2,050,000 — only 50,000 over) |
| 1BR below, 2BR above | Dubai Marina 2BR (2,500,000), The Greens 2BR (2,450,000), JBR 2BR (2,300,000), Business Bay 2BR (2,260,000) |
| no tracked unit type reaches it | JLT (2BR 1,900,000), JVC (2BR 1,490,000), Dubai Sports City (2BR 1,070,000), International City (1BR 450,000) |
A median splits the year's sales in half, so roughly half of Downtown one-bedrooms sold below AED 2,050,000 — and below the line. What counts is the value of your property at purchase, not the area median and not today's valuation. How joint ownership and off-plan units are treated we check before a deal. The conditions are in Golden Visa through property.
What the data cannot tell you
- A median is not a building. The spread between towers in one community can be wider than the spread between communities in this table.
- Mix shifts. JVC's one-bedrooms got smaller over time, which flatters or hides price moves.
- Small samples: Burj Khalifa (43 sales in 12 months) and the Arabian Ranches villa (61, on a different window: 15.09.2025–14.09.2026).
- Gross, not net. Yields ignore service charges, management and vacancy — see how to calculate net rental yield and service charges.
- 2025 losses are mostly the 4 % DLD fee, not falling prices; trustee, title deed and agent fees are not in the game at all.
Before you compare two actual apartments
A community table narrows a search; a purchase is one unit in one building, with its own comparable sales, service charges and title. Our real estate practice checks the property, the seller, encumbrances and unpaid building charges; we do not promise an outcome. The full cost on top of the price — the 4 % transfer fee and the fixed charges — is in the purchase costs calculator, and the steps are in buying property in Dubai.
FAQ
Which Dubai areas fell most in 2014–2020?
By the benchmark median: Burj Khalifa −56 % (small sample), Dubai Sports City −51 %, JLT −43 %, JBR −42 %. The smallest fall was JVC at −19 %, a figure distorted by smaller units selling in later years.
What are Dubai property prices by area today?
For a one-bedroom, from AED 450,000 (about USD 122,500) in International City to AED 2,900,000 (about USD 790,000) on Palm Jumeirah, based on DLD sales in the 12 months to 23.09.2026. A Burj Khalifa one-bedroom is AED 3,050,000.
Is Dubai Sports City a good investment?
We can only say what past purchases did. Sports City has the most losing cards in our game — 16 of 42, mostly bought in 2014–2018 — and its one-bedroom median is still 16 % below the 2015 peak. Units bought in 2019–2022 are up 28–66 % on price alone. None of this predicts the next cycle.
Which Dubai areas are above the Golden Visa threshold?
Benchmark one-bedroom medians are above AED 2 million in Downtown, Palm Jumeirah and Burj Khalifa; in Dubai Marina, JBR, The Greens and Business Bay the two-bedroom median is. Eligibility depends on your property's value at purchase, not on the median.
Why is JVC's sales count so high?
JVC recorded 4,250 sales across three unit types in 12 months, more than any other area here. It reflects turnover and supply of ready units, not future price direction.
Can I use this table to pick an area?
Not on its own. It records what already happened to medians and contains no forecast. A decision needs building-level sales, service charges and a document check.